
Impact score
Footprint Score across the two most representative contexts.
Homepage Score
Impact measured on the public homepage
- Time
- 26 ms
- Memory
- 0.0 MB
- SQL
- +0
- Assets
- 0
- HTTP ext.
- 0
Admin Score
Impact measured in the WordPress admin
- Time
- 33 ms
- Memory
- 0.0 MB
- SQL
- +0
- Assets
- 0
- HTTP ext.
- 0
About
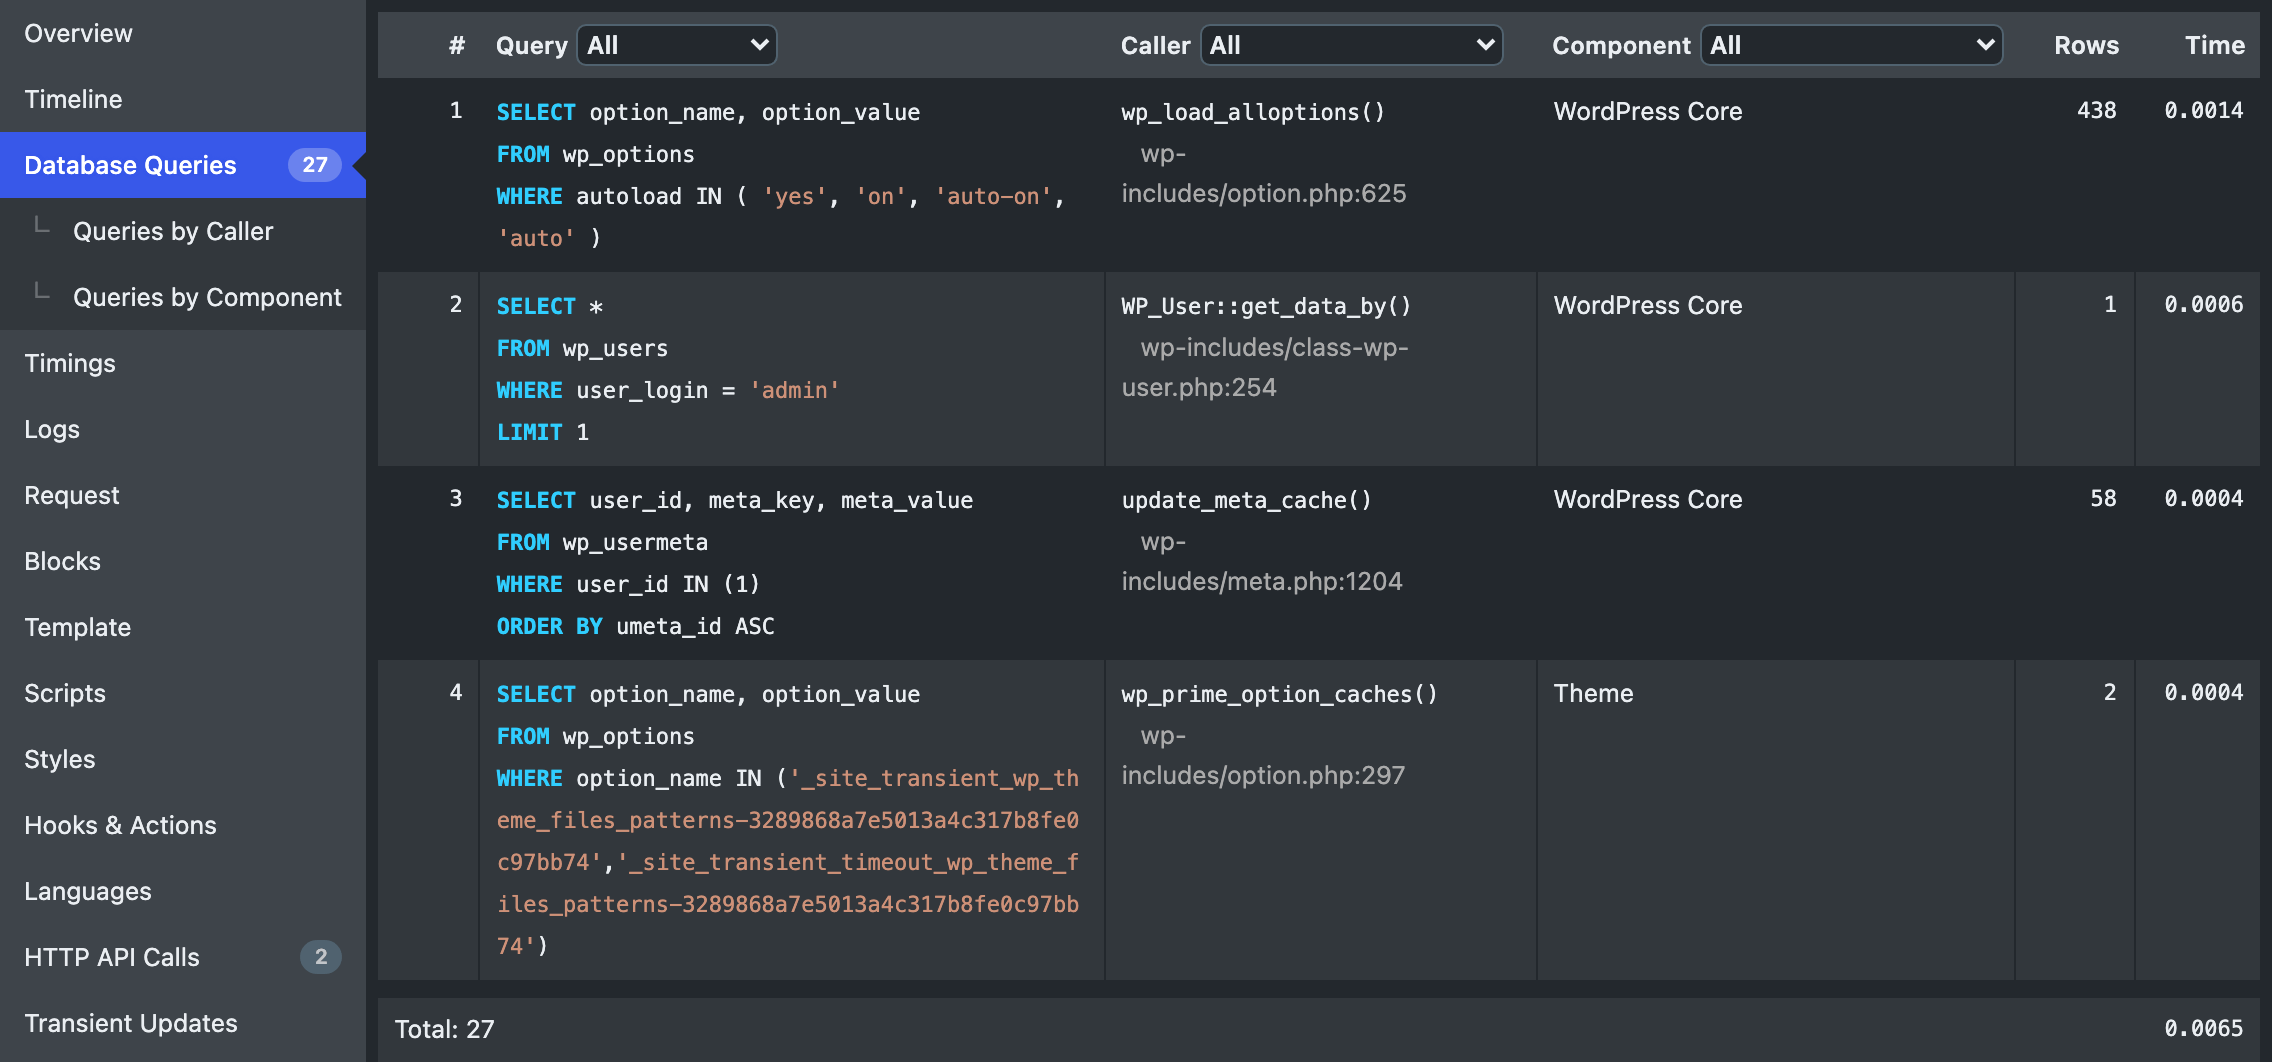
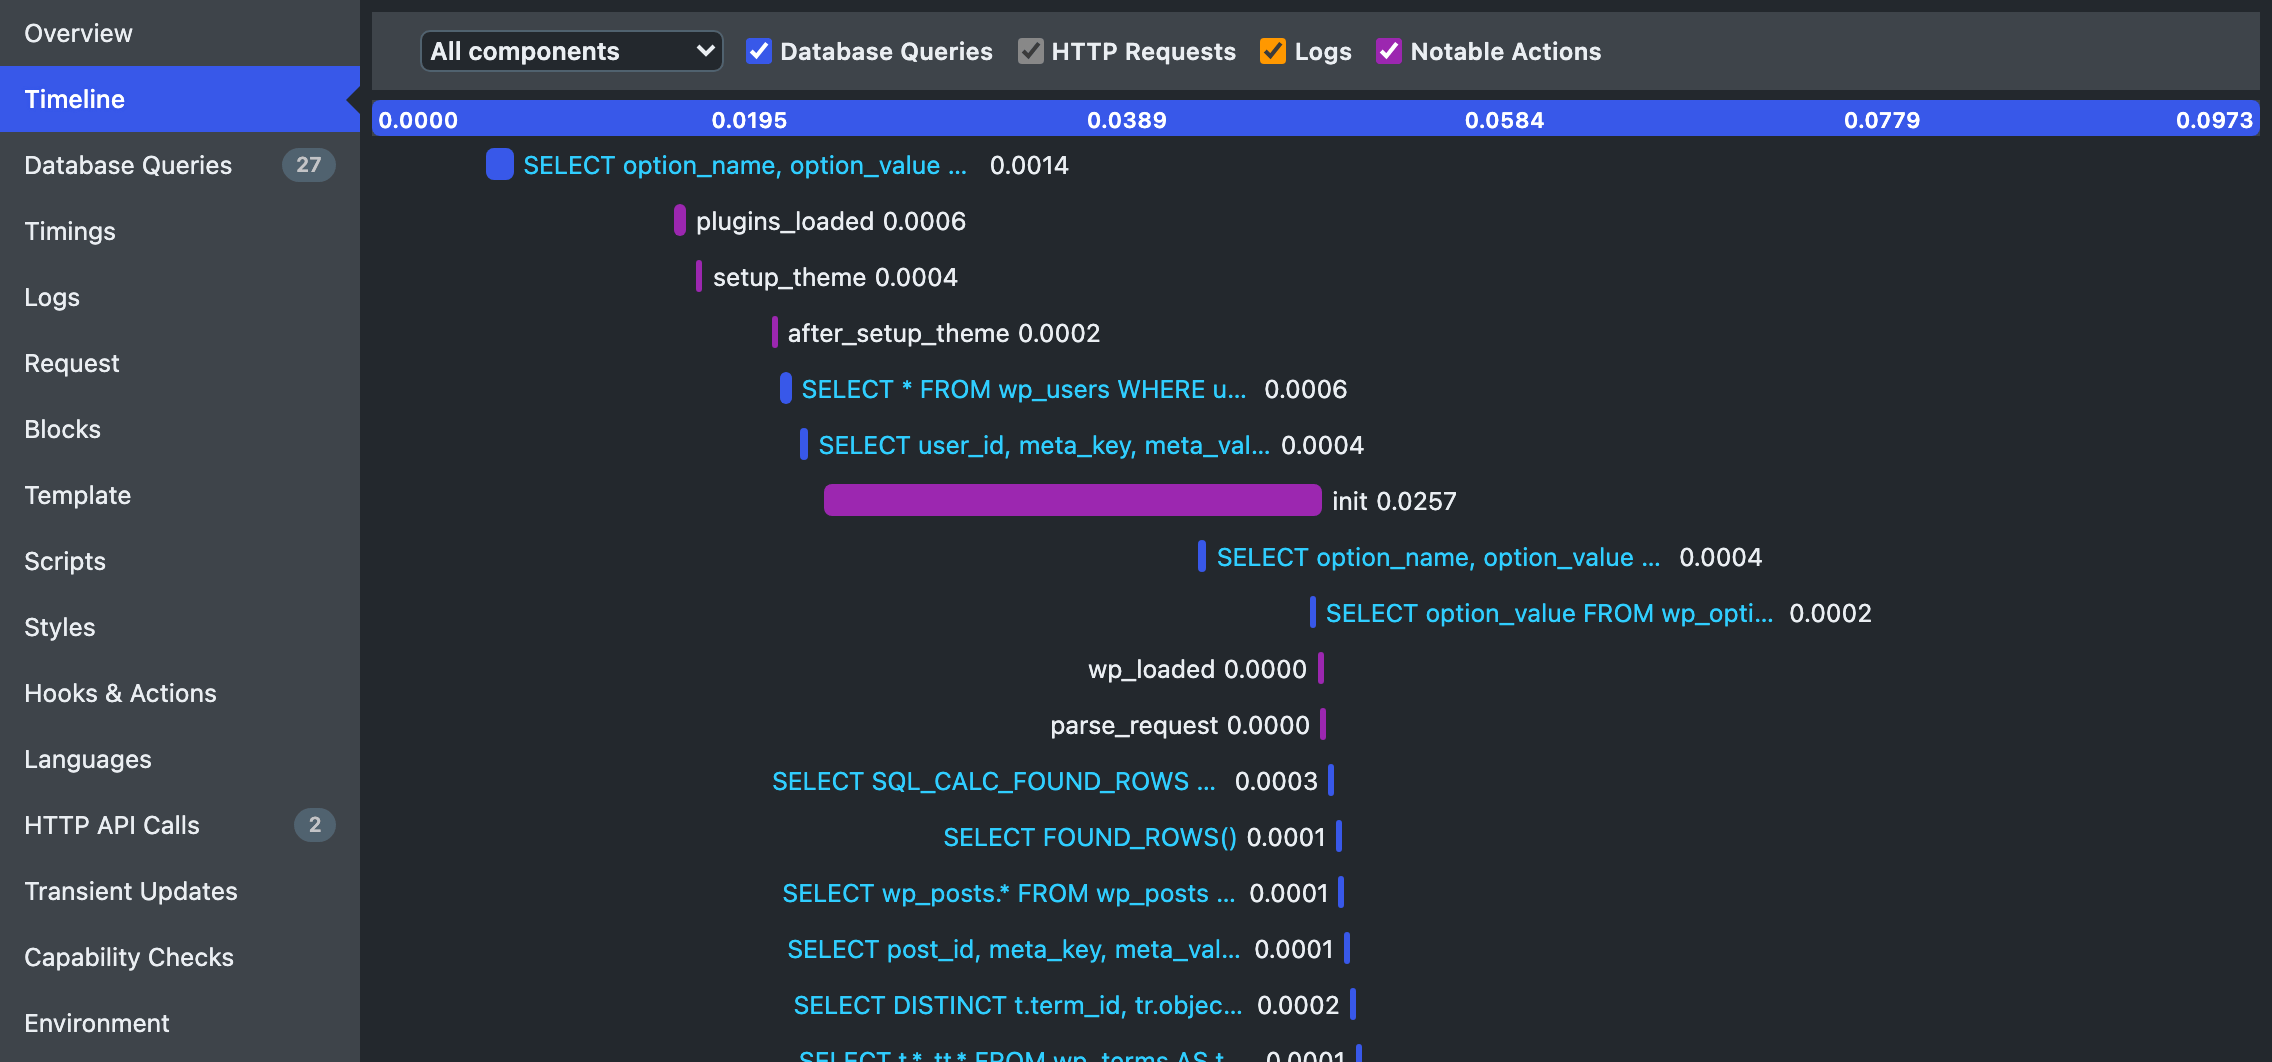
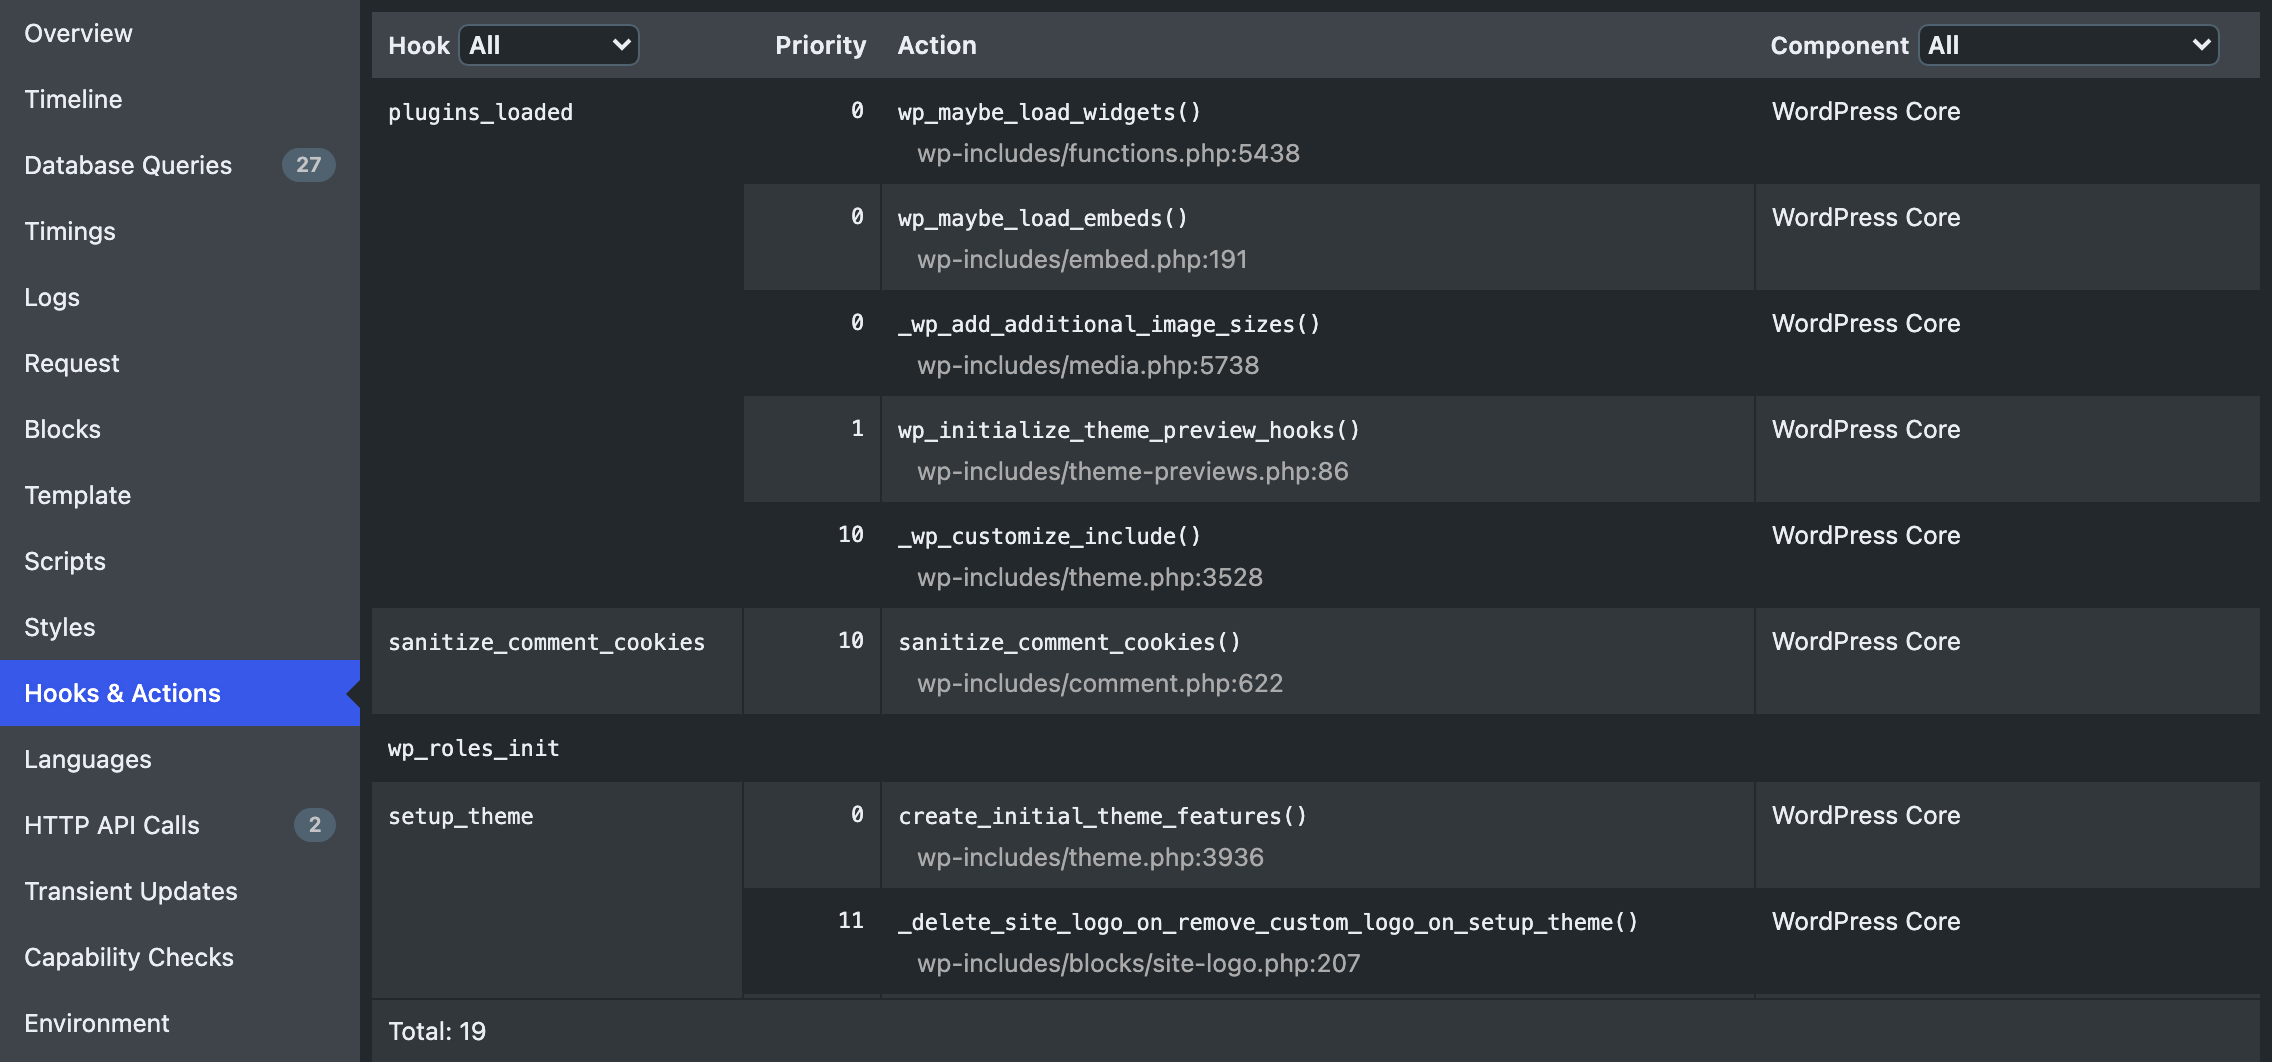
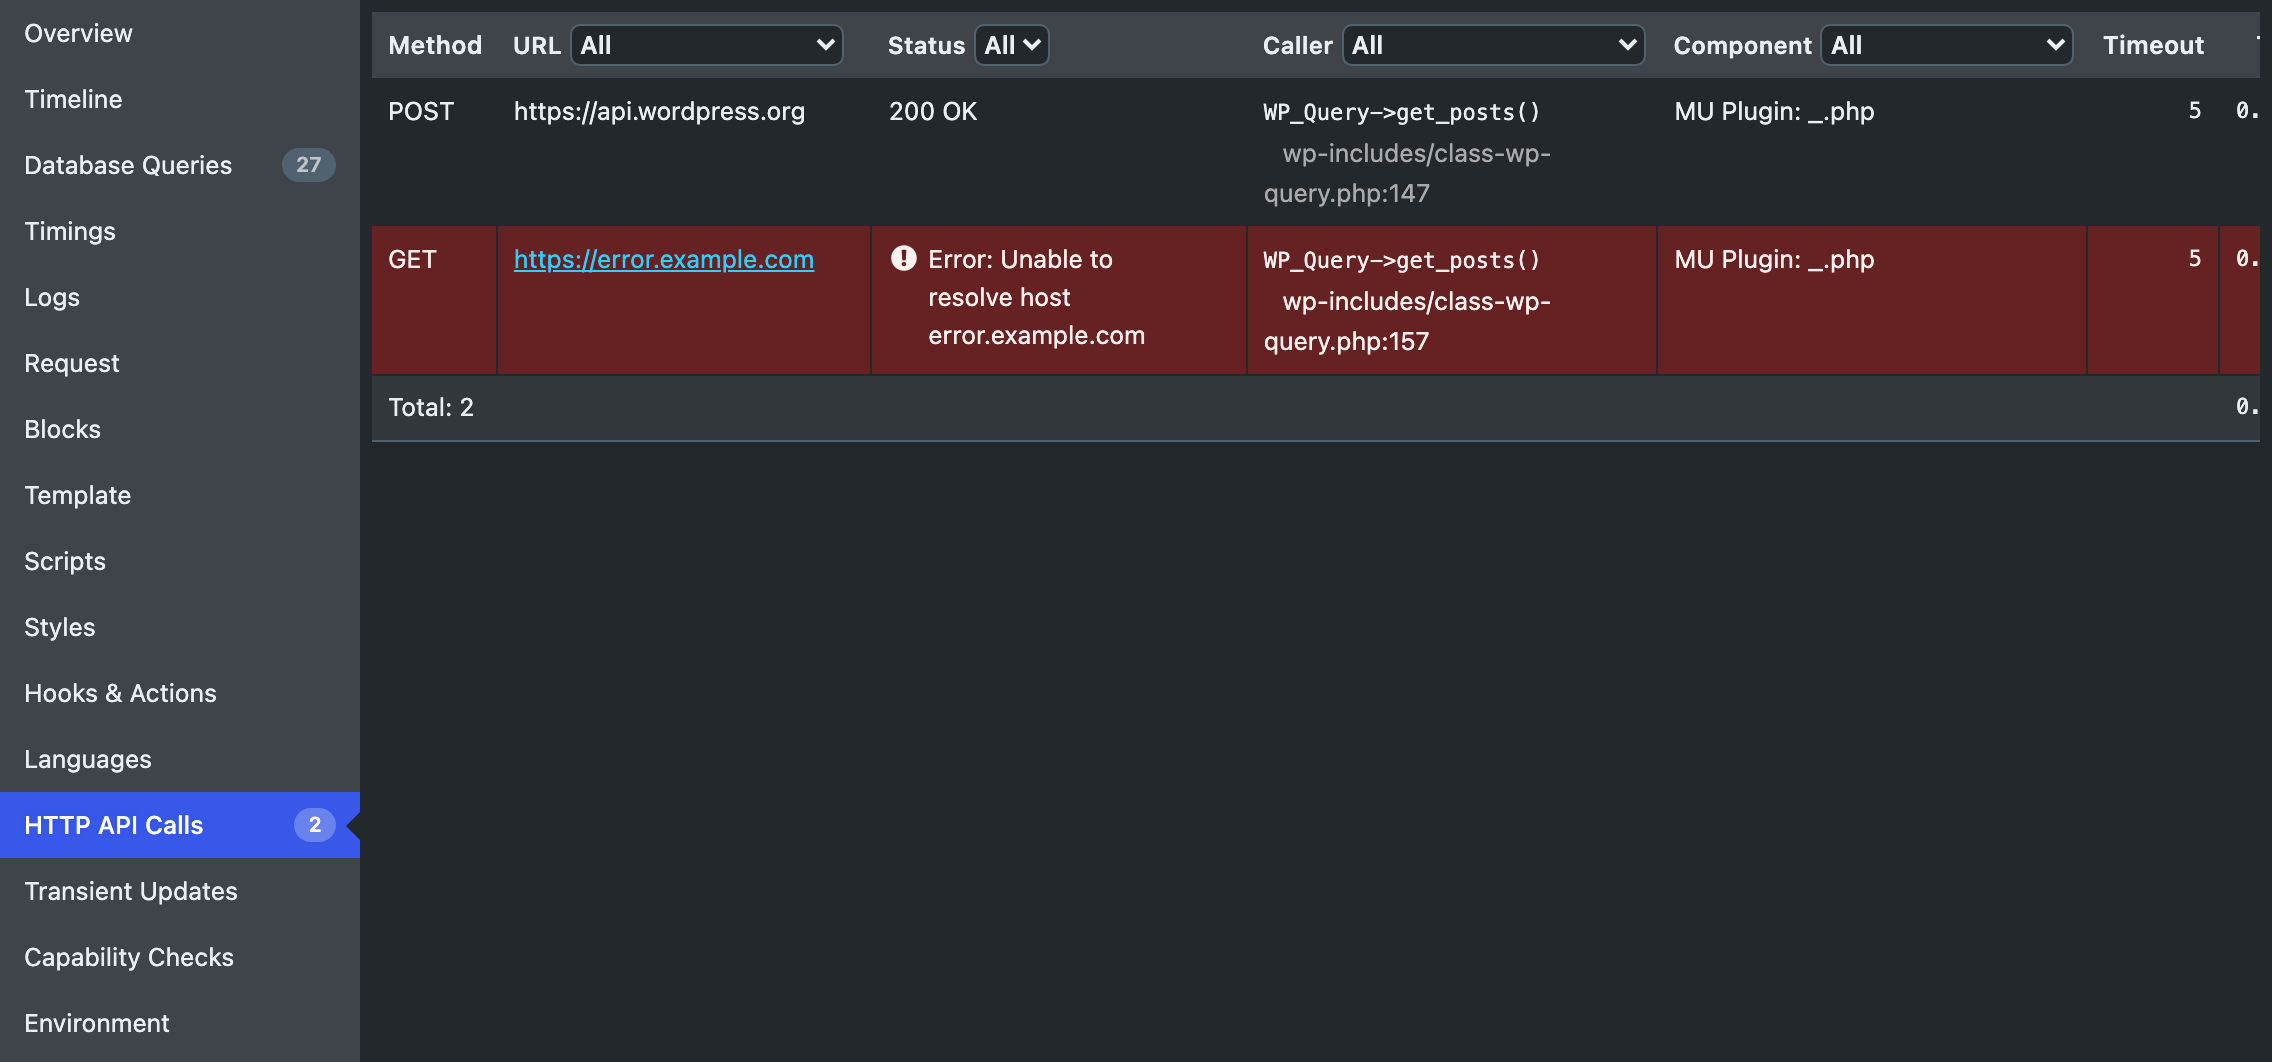
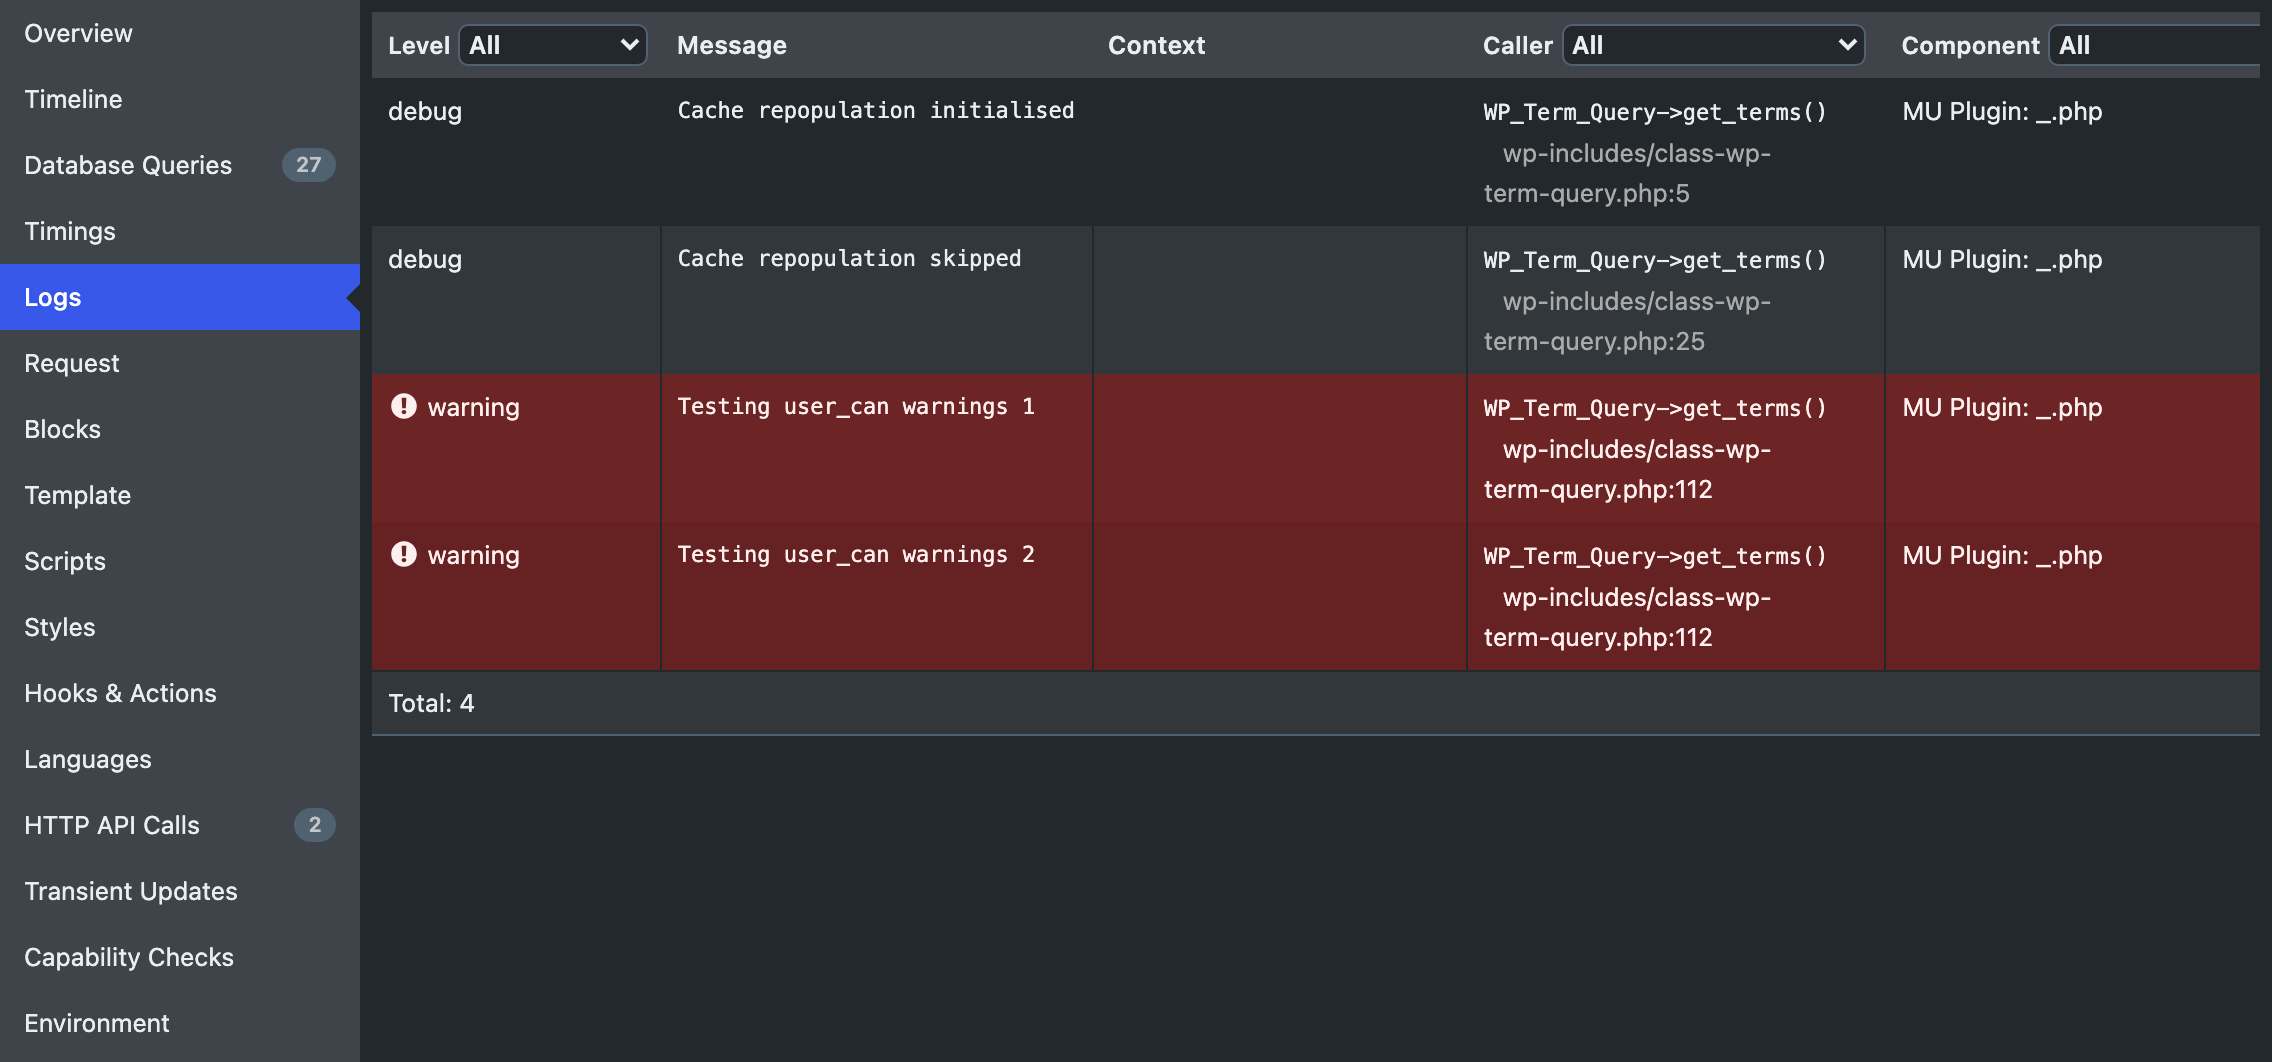
Query Monitor is the developer tools panel for WordPress and WooCommerce. It enables debugging of database queries, PHP errors, hooks and actions, block editor blocks, enqueued scripts and stylesheets, HTTP API calls, and more.
It includes some advanced features such as debugging of Ajax calls, REST API calls, user capability checks, and full support for block themes and full site editing. It includes the ability to narrow down much of its output by plugin or theme, allowing you to quickly determine poorly performing plugins, themes, or functions.
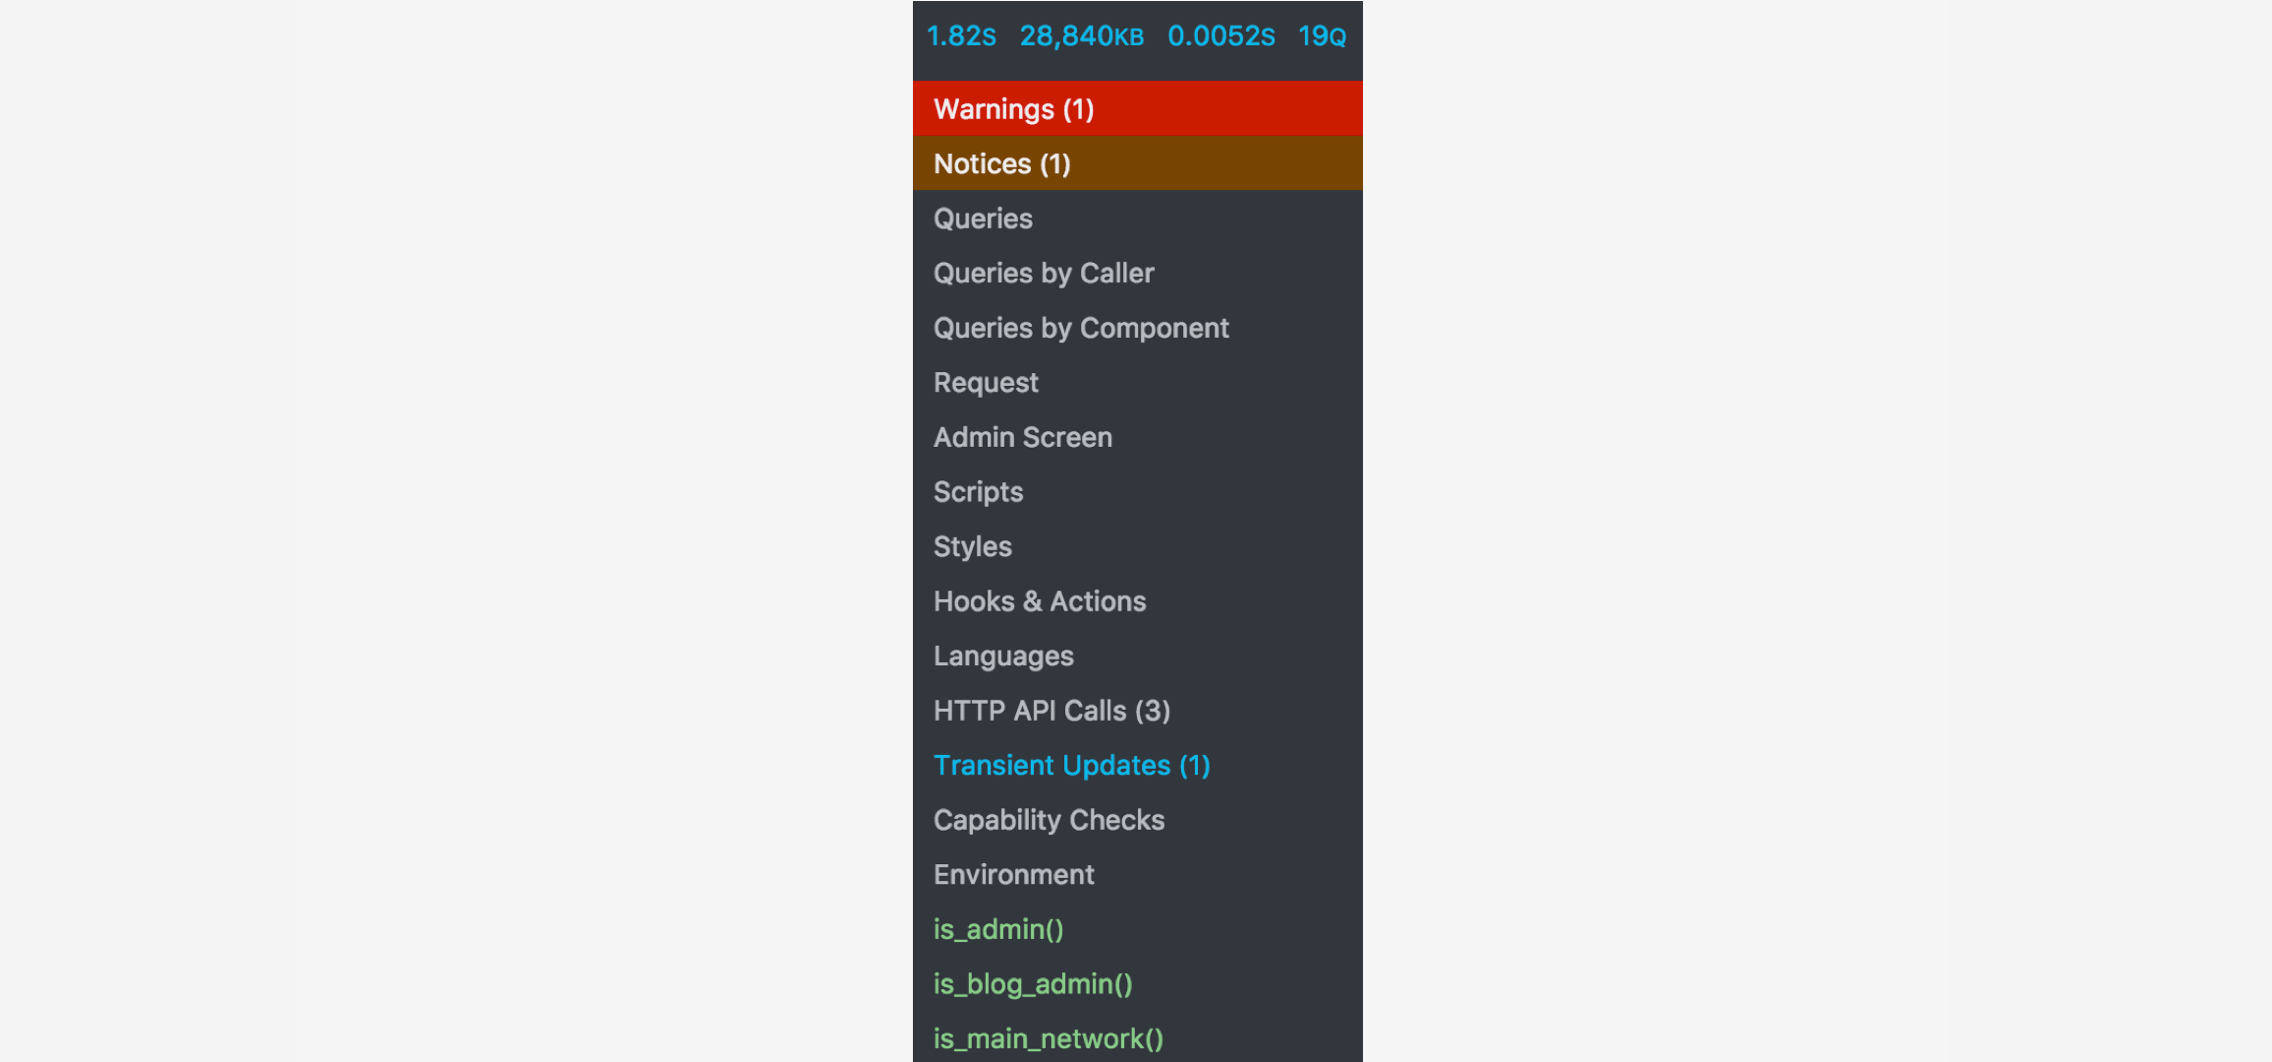
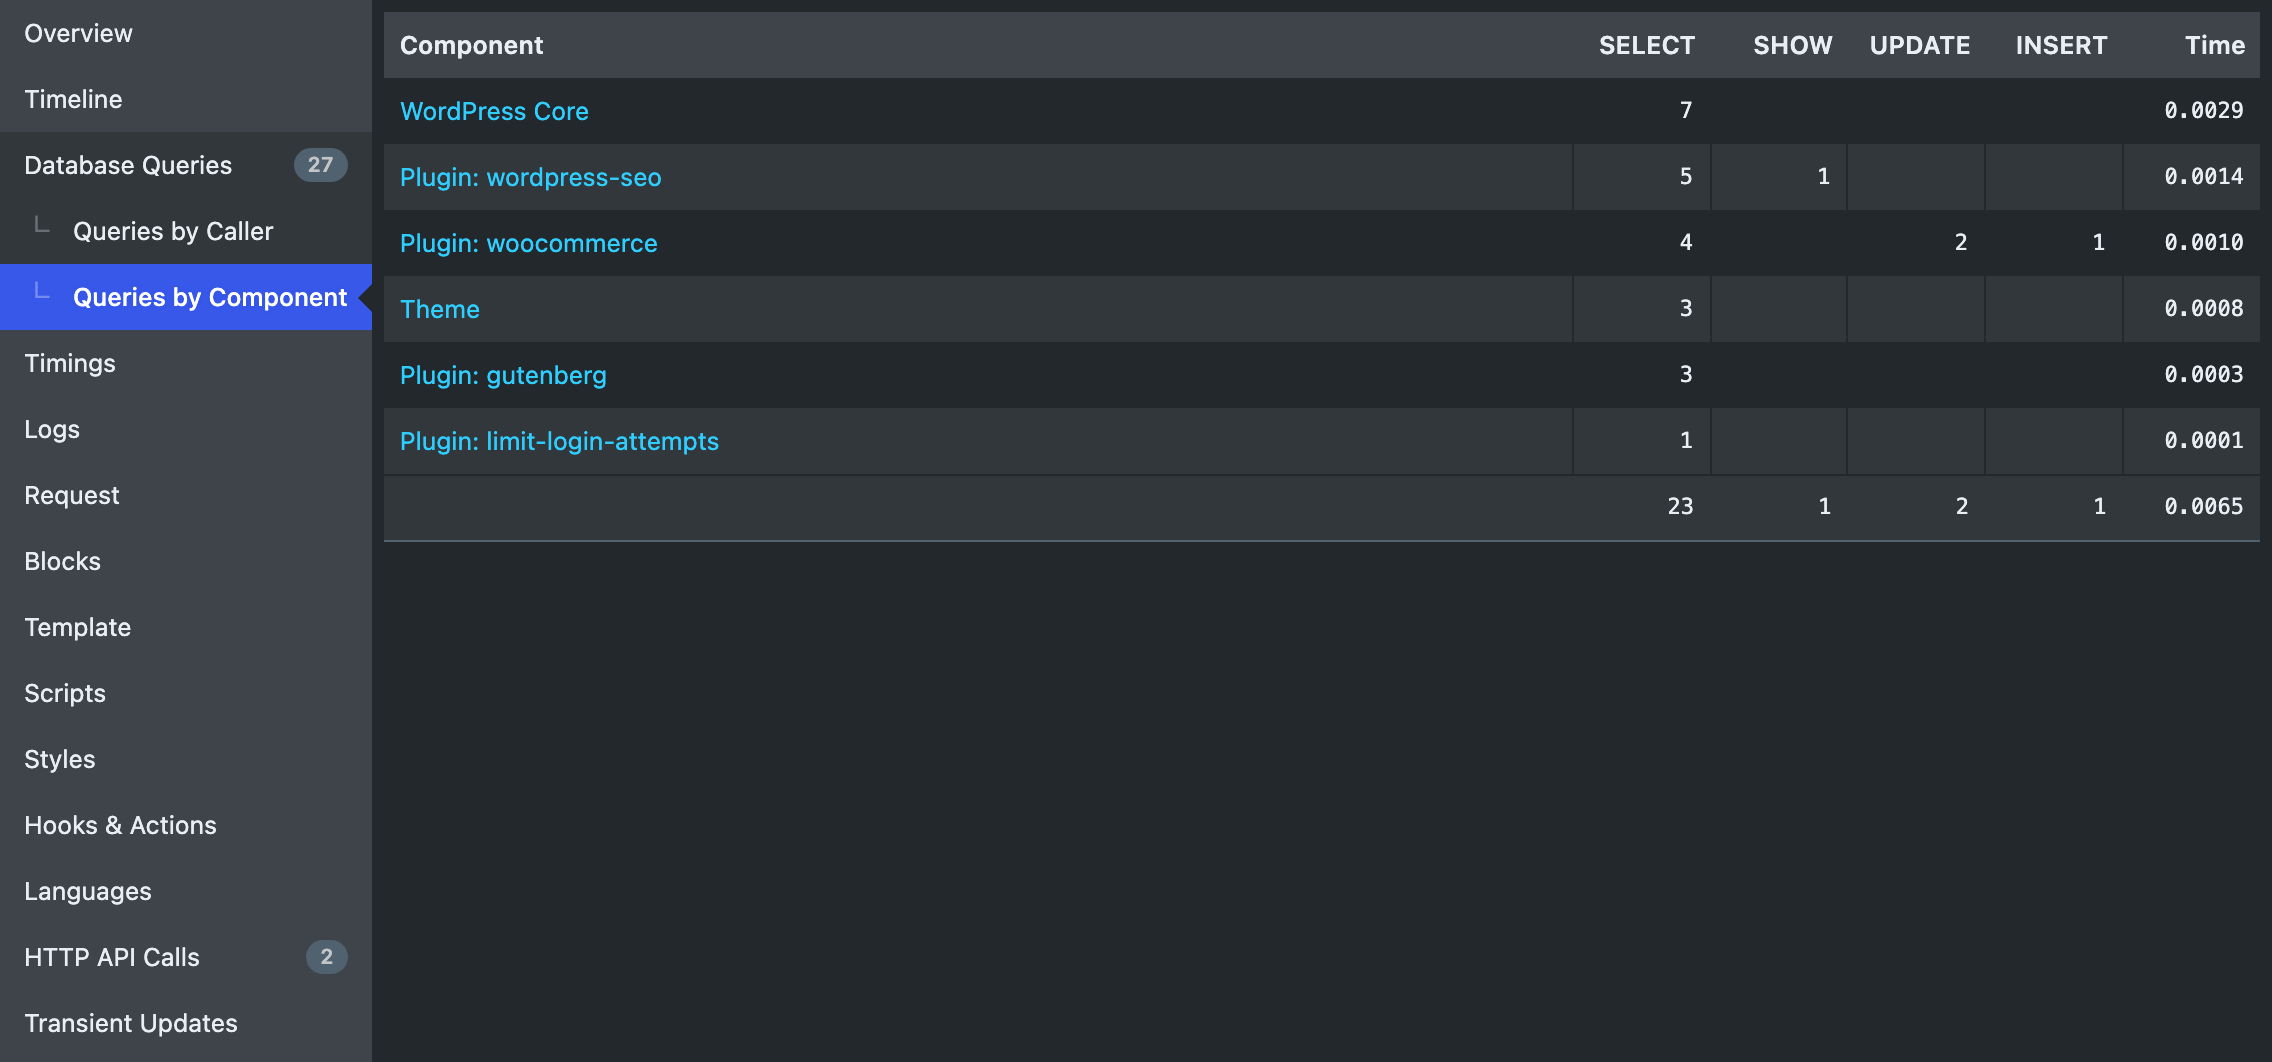
Query Monitor focuses heavily on presenting its information in a useful manner, for example by showing aggregate database queries grouped by the plugins, themes, or functions that are responsible for them. It adds an admin toolbar menu showing an overview of the current page, with complete debugging information shown in panels once you select a menu item.
Read more Show less
Query Monitor supports versions of WordPress up to three years old, and PHP version 7.4 or higher.
For complete information, please see the Query Monitor website.
Here’s an overview of what’s shown for each page load:
In addition:
By default, Query Monitor’s output is only shown to Administrators on single-site installations, and Super Admins on Multisite installations.
In addition to this, you can set an authentication cookie which allows you to view Query Monitor output when you’re not logged in (or if you’re logged in as a non-Administrator). See the Settings panel for details.
Query Monitor is also available as an optional browser dev tools extension. This is an alternative to using the in-page panel that gets output into the admin toolbar.
Using the browser extension has some advantages over the in-page panel:
Information about the Query Monitor browser extension can be found here.
I maintain several other plugins for developers. Check them out:
The time that I spend maintaining this plugin and others is in part sponsored by:
Query Monitor is private by default and always will be. It does not persistently store any of the data that it collects. It does not send data to any third party, nor does it include any third party resources. Query Monitor’s full privacy statement can be found here.
Query Monitor aims to be fully accessible to all of its users. Query Monitor’s full accessibility statement can be found here.
Screenshots
Author-supplied previews from wordpress.org.
Per-version history
Show per-version detail (1 versions)
Per-version history
Show per-version detail (1 versions)
How the plugin evolves version by version.
| Version | Homepage | Admin | Last scan |
|---|---|---|---|
| v4.0.7 | 1 scan | 1 scan | 3 hours ago |
Scan history
Show individual scan log (2 scans)
Scan history
Show individual scan log (2 scans)
| Date | Version | Context | Score | Grade | Time | Memory |
|---|---|---|---|---|---|---|
| 3 hours ago | v4.0.7 | Homepage | 100/100 | A | 26 ms | 0.0 MB |
| 3 hours ago | v4.0.7 | Admin | 99/100 | A | 33 ms | 0.0 MB |